AWS Foundational Skills: How to get started with CloudWatch


Introduction
Welcome to the first post of our new blog series: Foundation blogs. These blogs will provide detailed supplemental information that complements the finder/fixer processes covered in our Fixer blog series. Think of Foundation blogs like reference material – the useful background knowledge that you need to achieve meaningful, ongoing AWS savings.
Up first: Amazon CloudWatch. Our inaugural Foundation blog will go over the CloudWatch basics: what it is, how to make sure it’s installed, how to configure it correctly, and how to monitor CloudWatch metrics. We will also talk about how to respond to CloudWatch alarms with Lambda functions, as well as details about the CloudWatch agent. Consider it your CloudWatch starter pack… now let’s get started.
Table of Contents
- CloudWatch fundamentals: metrics, statistics, alarms, and dashboards
- Which CloudWatch metrics should you monitor?
- Introducing the CloudWatch agent
- How to install the CloudWatch agent
- How to configure and start the CloudWatch agent
- Validating VPC DNS for CloudWatch and SSM agents
- Validating VPC endpoints for CloudWatch and SSM agents
- Responding to CloudWatch alarms with a Lambda Function
- CloudFix ❤s CloudWatch
1. CloudWatch fundamentals: metrics, statistics, alarms, and dashboards
Let’s kick it off with an analogy. Say we think of AWS architectures as living organisms. The high-level services like EC2, S3, DynamoDB, RDS, and Lambda would be the key organs… the heart, lungs, stomach, liver, etc. In this analogy, Amazon CloudWatch is the nervous system. CloudWatch gathers metrics from all of the different AWS services, aggregates and summarizes this data, and takes action if necessary.
The insights and actions delivered by CloudWatch enable us to implement a variety of automatic optimizations. For example, just like our nervous system causes us to sweat when we’re exercising, CloudWatch can trigger an alarm to cause autoscaling actions on EC2 instances when there are high levels of load. This capability makes it a key component of many of our CloudFix finder/fixers.
1.1 CloudWatch metrics and statistics
CloudWatch uses metrics and statistics to monitor AWS services.
A CloudWatch metric is a particular quantity that’s being monitored. At first, CloudWatch only monitored EC2 instances, with metrics like CPU load, disk I/O, and network I/O. As the number of AWS services increased, so did the metrics that CloudWatch could keep track of. Services such as EBS, RDS, ELB, SQS, SNS, Lambda, and others now include basic metrics that are automatically sent to CloudFix at no charge as part of the CloudWatch free tier. Example metrics for Lambda, for instance, include Invocations, Duration, Errors, Throttles, ConcurrentExecutions, etc., and are monitored for every Lambda function by default.
Statistics are CloudWatch’s aggregation of metrics. For example, if you are looking at a statistic like CPUUtilization, you may be interested in the average value of that metric over a certain amount of time. You could use CloudWatch statistics to compute this. For more information, have a look at CloudWatch statistics definitions.
1.2 CloudWatch metric alarms and composite alarms
CloudWatch alarms are the means of taking action based on the behavior of CloudWatch metrics. Alarms take CloudWatch metrics as input, do aggregations based on these metrics, and publish messages to SNS topics.
There are two types of CloudWatch alarms: metric alarms and composite alarms. A metric alarm looks at either a metric (CPUUtilization) or a statistic of a metric (average CPUUtilization).
A composite alarm can take other alarms as input. For instance, if you had two metric alarms monitoring CPUUtilization and MemoryUtilization (this would require the CloudWatch Agent, more on that in a bit), then you could create a composite alarm that monitored both individual alarms. This HighCPUHighMemory composite alarm would be triggered only if both CPU usage and memory usage are high (with “high” defined in the details of the two metric alarms). This can help you manage your resources more effectively by reducing the number of false alarms and allowing you to act on more meaningful combined alarms.
1.3 CloudWatch dashboards
CloudWatch not only gathers data, it helps you aggregate and visualize it. With CloudWatch, you can monitor across accounts and across regions. Have a look at AWS’s cross-account cross-region dashboards page for more details.
CloudWatch dashboards provide visualizations for the various metrics that are being monitored. You can have widgets displaying line graphs, numbers, gauges, and even custom widgets powered by AWS Lambda functions. CloudWatch dashboards truly offer a huge amount of functionality and flexibility. This CloudWatch Dashboard AWS workshop is a great place to get started.
2. Which CloudWatch metrics should you monitor?
This is a complicated question. The simple answer is “monitor everything.” However, while the data scientist in me would love that, it’s not very practical. Monitoring everything comes with costs, in time, money, and complexity. It would be fun, but alas, just isn’t worth it.
Instead, set up your monitoring to help you understand the dynamics of your AWS deployment. In other words, make it your guiding principle to monitor how things are failing, not just for failure state itself.
As an example, the StatusCheckFailed metric of an EC2 instance tells you about the reachability of system checks. The StatusCheckFailed metric is binary, either true or false. If it’s true, it means that the instance is nonresponsive. Any workloads served by this instance will fail. This is monitoring a failure state.
To monitor a dynamic that can show if an EC2 instance may be heading towards failure, look at CPUUtilization, MemoryUtilization, DiskSpaceUtilization, DiskReadOperations, DiskWriteOperations, etc. These sorts of metrics indicate that a machine may be extremely busy. Combined with a CloudWatch alarm that reports when these metrics are past expected thresholds for an extended period of time, this can serve as an early warning system that an instance is nearing failure. Additionally, by analyzing this data over time, you will learn how the machines are failing and can put the right remediation measures into place.
3. Introducing the CloudWatch Agent
The CloudWatch agent (CW Agent) is a small program that runs on EC2 instances that can report on more detailed metrics. In addition to EC2 instances, the CW agent can also monitor on-prem servers. This enables you to have a consistent set of metrics across all your infrastructure, even in a hybrid deployment. The agent can run on both Linux and Windows.
The metrics that the agent collects are considered “custom metrics” and are not part of the free tier. Metrics collected by the agent include detailed CPU information (cpu_time_active, cpu_time_system, etc.), disk usage information (diskio_reads, disio_writes, etc.), memory usage information (mem_active, mem_available_percent, etc.), network, process, and swap space usage information. The full list of CloudWatch agent metrics is available here.
At CloudFix, we use custom metrics provided by the CW agent to monitor EC2 instance performance, especially after an EC2 instance retyping or resizing operation.
4. How to install the CloudWatch Agent
As mentioned above, the CloudWatch agent is available on both Linux and Windows. Let’s look at how to install the agent on both platforms.
4.1 Installing the CloudWatch Agent on Linux
If you are using Amazon Linux, the CloudWatch Agent is available as a package.
Amazon Linux 2:
sudo yum update -y
sudo yum install -y amazon-cloudwatch-agent
Amazon Linux 1:
sudo yum update -y
wget https://s3.amazonaws.com/amazoncloudwatch-agent/amazon_linux/amd64/latest/amazon-cloudwatch-agent.rpm
sudo rpm -Uvh ./amazon-cloudwatch-agent.rpm
Debian-based Linux Distributions:
wget https://s3.amazonaws.com/amazoncloudwatch-agent/ubuntu/amd64/latest/amazon-cloudwatch-agent.deb
sudo dpkg -i -E ./amazon-cloudwatch-agent.deb
sudo /opt/aws/amazon-cloudwatch-agent/bin/amazon-cloudwatch-agent-ctl -a fetch-config -m ec2 -c
In production, you want to either bake this into your own custom AMI or use a user data script, which can run commands on a Linux instance when it launches.
4.2 Installing the CloudWatch Agent on Windows
Download the installer from this URL:
https://s3.amazonaws.com/amazoncloudwatch-agent/windows/amd64/latest/amazon-cloudwatch-agent.msi
Double click and proceed through the steps of the installation wizard. The default installation location is C:\Program Files\Amazon\AmazonCloudWatchAgent.
5. How to configure and start the CloudWatch Agent
5.1 Configuring and starting the CloudWatch agent on Linux
To configure the CloudWatch agent, you need to create a configuration file. This file configures the agent itself, along with the metrics it collects and the logs that are published to the CloudWatch Logs service. You can either manually create the configuration file in JSON or TOML format or use the configuration wizard:
sudo /opt/aws/amazon-cloudwatch-agent/bin/amazon-cloudwatch-agent-config-wizardAnswer the prompts in the wizard, and it will generate the configuration file: /opt/aws/amazon-cloudwatch-agent/etc/amazon-cloudwatch-agent.json.
sudo /opt/aws/amazon-cloudwatch-agent/bin/amazon-cloudwatch-agent-ctl -a fetch-config -m ec2 -s -c file:/opt/aws/amazon-cloudwatch-agent/etc/amazon-cloudwatch-agent.jsonThe CloudWatch agent is now installed and running on your Amazon Linux instance. It will collect metrics and logs based on the configuration you provided and send them to CloudWatch. Check the cloud-init-output.log file to make sure that the agent is running:
tail -f /var/log/cloud-init-output.logOnce you have gone through these steps, make sure that the CW agent will start again if the machine reboots:
sudo systemctl enable amazon-cloudwatch-agent.service5.2 Configuring and starting the CloudWatch agent on Windows
On Windows, after you have installed the CloudWatch Agent, you can use the configuration wizard or create the configuration file manually. To start the wizard, launch the amazon-cloudwatch-agent-config-wizard.exe program. By default it’s located in the C:\Program Files\Amazon\AmazonCloudWatchAgent directory.
To create or edit the config file manually, use a text editor. The file is located at C:\Program Files\Amazon\AmazonCloudWatchAgent\config.json.
Once you have configured CloudWatch Agent to your liking, open up a command prompt with administrative rights, and use the following command to configure the agent as a service, so it will start when the instance reboots:
"C:\Program Files\Amazon\AmazonCloudWatchAgent\amazon-cloudwatch-agent-ctl.ps1" -a install6. Validating VPC DNS for CloudWatch and SSM agents
For CloudWatch and SSM agents to work properly, they need to send the data they record to the CloudWatch / Systems Manager services. That means that there must be a network route between the monitored instance and the CloudWatch service, so DNS needs to be functioning correctly. Within a VPC, it’s easy to disable DNS, so it’s important to double check that DNS is enabled. Doing so is a two-step process:
- Gather the list of VPCs with active EC2 instances in your organization
- For each VPC, make sure that
enableDnsSupportandenableDnsHostnamesare enabled
Let’s dig in.
The easiest way to identify VPCs with active EC2 instances is to use the AWS Cost and Usage Report (CUR). With a CUR query, you can list the accounts with active EC2 instances:
SELECT
        line_item_usage_account_id AS account_id
      , product_region AS region
FROM  <YOUR CUR DB>.<YOUR CUR TABLE>
WHERE line_item_usage_start_date
       BETWEEN date_trunc('week', current_date - interval '8' day)
       AND date_trunc('week', current_date - interval '1' day)
AND line_item_line_item_type = 'Usage'
AND line_item_product_code = 'AmazonEC2'
AND line_item_resource_id LIKE 'i-%'
GROUP BY 1, 2;
The output of this query would look like:
|
account_id |
region |
|
123456789012 |
us-east-1 |
|
123456789012 |
us-west-1 |
|
234567890123 |
us-east-2 |
|
345678901234 |
eu-central-1 |
Note that this query is filtering on the line_item_resource_id to look for resource identifiers that look like EC2 instance identifiers. However, it’s not returning the IDs of the individual EC2 instances. Instead, it’s returning a list of account_ids and regions with EC2 instances that have been running within the past seven days.
Once you have the list of account_ids and regions of interest (or you can take the brute force approach and iterate over all of your accounts and all regions), the next step is to use the DescribeVpcs API call to check if the VPC is active.
import boto3

def get_credentials(account_id):
    # Add logic to retrieve AWS credentials for the given account_id
    pass

def describe_vpcs(credentials, region):
    session = boto3.Session(
        aws_access_key_id=credentials['aws_access_key_id'],
        aws_secret_access_key=credentials['aws_secret_access_key'],
        region_name=region
    )

    ec2 = session.client('ec2')
    response = ec2.describe_vpcs()
    return response['Vpcs']

if __name__ == "__main__":
    account_region_list = [
        ('123456789012', 'us-east-1'),
        ('234567890123', 'us-west-2'),
        # Add more account_id and region tuples as needed
    ]

    for account_id, region in account_region_list:
        credentials = get_credentials(account_id)
        vpcs = describe_vpcs(credentials, region)
        print(f"VPCs for account {account_id} in region {region}:")
        for vpc in vpcs:
            print(f"  - VPC ID: {vpc['VpcId']}, CIDR Block: {vpc['CidrBlock']}")
Each account_id has its own set of credentials, so you need to have some mechanism to manage this. The full VPC response object looks like this:
{
  "Vpcs": [
    {
      "CidrBlock": "10.0.0.0/16",
      "VpcId": "vpc-abcdefgh",
      "State": "available",
      "InstanceTenancy": "default",
      "IsDefault": false,
      "Tags": [
        {
          "Key": "Name",
          "Value": "MyVPC"
        }
      ],
      "DhcpOptionsId": "dopt-12345678",
      "CidrBlockAssociationSet": [
        {
          "AssociationId": "cidr-assoc-ab123456",
          "CidBlock": "10.0.0.0/16",
          "CidrBlockState": {
            "State": "associated"
          }
        }
      ],
      "OwnerId": "123456789012",
      "Ipv6CidrBlockAssociationSet": []
    }
  ]
}
Look for VPCs with the State equal to available. Once you have a list of VPCs in an available state, call the DescribeVpcAttribute API to check on the enableDnsSupport and enableDnsHostnames config values. This can be done with the following bit of code:
def describe_vpc_attribute(credentials, region, vpc_id, attribute):
    session = boto3.Session(
        aws_access_key_id=credentials['aws_access_key_id'],
        aws_secret_access_key=credentials['aws_secret_access_key'],
        region_name=region
    )

    ec2 = session.client('ec2')
    response = ec2.describe_vpc_attribute(VpcId=vpc_id, Attribute=attribute)
    return response

dns_support_response = describe_vpc_attribute(credentials, 'us-east-1', vpc_id, 'enableDnsSupport')
print(dns_support_response)

dns_hostnames_response = describe_vpc_attribute(credentials, 'us-east-1', vpc_id, 'enableDnsHostnames')
print(dns_hostnames_response)
The response objects look like:
{
  'VpcId': 'vpc-abcdefgh',
  'EnableDnsSupport': {
      'Value': True
  },
  'ResponseMetadata': {
      'RequestId': '12345678-1234-1234-1234-12345678',
      'HTTPStatusCode': 200,
      'HTTPHeaders': {…
    },
      'RetryAttempts': 0
  }
}
To enable the desired attributes, you can use this function. It first checks the current status of DNS support using the describevpcattribute function. If DNS support is disabled, it enables DNS support using the modifyvpcattribute method. After that, it checks the status of DNS hostnames and enables DNS hostnames if they are also disabled.
def enable_dns_support_and_hostnames(credentials, region, vpc_id):
    session = boto3.Session(
        aws_access_key_id=credentials['aws_access_key_id'],
        aws_secret_access_key=credentials['aws_secret_access_key'],
        region_name=region
    )

    ec2 = session.client('ec2')

    dns_support_response = describe_vpc_attribute(credentials, region, vpc_id, 'enableDnsSupport')

    if not dns_support_response['EnableDnsSupport']['Value']:
        ec2.modify_vpc_attribute(VpcId=vpc_id, EnableDnsSupport={'Value': True})

        dns_hostnames_response = describe_vpc_attribute(credentials, region, vpc_id, 'enableDnsHostnames')

        if not dns_hostnames_response['EnableDnsHostnames']['Value']:
            ec2.modify_vpc_attribute(VpcId=vpc_id, EnableDnsHostnames={'Value': True})
Do it with CloudFix:
You can also ensure that DNS is enabled automatically with CloudFix. The CloudFix VPC DNS for Agents finder/fixer runs the same process in just a few clicks. Simply approve the changes and DNS will be configured properly for each VPC that has an active EC2 instance.
7. Validating VPC endpoints for CloudWatch and SSM agents
So, we’ve established that CloudWatch and SSM agents need to have access to DNS within the VPC so that these agents can connect to their respective AWS services. In addition to DNS, the agents also require a route from their VPCs to CloudWatch, Systems Manager, and S3. If instances don’t have access to these services, they won’t function properly.
To ensure that access, let’s look at how to check, and enable if necessary, VPC endpoints to reach CloudWatch, SSM, and S3. Here are the steps in the process:
- A CUR query finds (account, region) pairs with active EC2 instances in all accounts and regions
- We use EC2 APIs to check which instances are running in the (account, region) pairs and identify the VPCs that host these instances
- For each VPC:
- Get all subnets
- Identify private subnets that can’t access the internet
- For subnets identified above:
- Check for VPC endpoints for
ssm,ec2messages,ssmmessages,monitoring, ands3 - For each missing endpoint from the previous step, find a private subnet that has IP addresses available and create a VPC endpoint
- Check for VPC endpoints for
The services, AWS service name, and VPC endpoint type are specified in the following table:
|
Service |
AWS Service Name |
VPC Endpoint Type |
|
SSM |
com.amazonaws.<REGION>.ssm |
Interface |
|
EC2 Messages |
com.amazonaws.<REGION>.ec2messages |
Interface |
|
SSM Messages |
com.amazonaws.<REGION>.ssmmessages |
Interface |
|
Monitoring |
com.amazonaws.<REGION>.monitoring |
Interface |
|
S3 |
com.amazonaws.<REGION>.s3 |
Gateway |
To get started, we find (account, region) pairs using the CUR query in the previous section. When we have a pair, using the following function to list EC2 instances:
def get_credentials(account_id):
    # Add logic to retrieve AWS credentials for the given account_id
    pass

def get_active_ec2_instances(credentials, region):
    session = boto3.Session(
        aws_access_key_id=credentials['aws_access_key_id'],
        aws_secret_access_key=credentials['aws_secret_access_key'],
        region_name=region
    )

    ec2 = session.resource('ec2')
    instances = ec2.instances.filter(
        Filters=[{'Name': 'instance-state-name', 'Values': ['running']}]
    )

    active_instances = []
    for instance in instances:
        active_instances.append({
            'InstanceID': instance.instance_id,
            'InstanceState': instance.state['Name'],
            'InstanceType': instance.instance_type,
            'Region': region
        })

    return active_instances
This returns a list of instances. For a given set of instance_ids, get the VPCs associated with these instance IDs:
def get_ec2_instance_vpcs(credentials, region, instance_ids):
    session = boto3.Session(
        aws_access_key_id=credentials['aws_access_key_id'],
        aws_secret_access_key=credentials['aws_secret_access_key'],
        region_name=region
    )

    ec2 = session.client('ec2')
    response = ec2.describe_instances(InstanceIds=instance_ids)
    reservations = response.get('Reservations', [])

    instance_vpcs = {}
    for reservation in reservations:
        for instance in reservation.get('Instances', []):
            instance_vpcs[instance['InstanceId']] = instance['VpcId']

    return instance_vpcs
This function builds up an instance_vpcs dictionary. This data structure has one entry per instance, which makes sense since each EC2 instance can only belong to one VPC. Multiple instances can, however, still belong to the same VPC, so we need to de-duplicate the list of VPCs. Then, for each VPC, we need to check to see which VPCs don’t have access to the internet. If the VPCs do have internet access, the agents can use that. It’s therefore only subnets without internet access that require the VPC endpoints.
Use the following function to check if a given VPC has private subnets without internet access:
def get_subnets_without_internet(credentials, region, vpc_id):
    session = boto3.Session(
        aws_access_key_id=credentials['aws_access_key_id'],
        aws_secret_access_key=credentials['aws_secret_access_key'],
        region_name=region
    )

    ec2 = session.client('ec2')

    subnets_response = ec2.describe_subnets(Filters=[{'Name': 'vpc-id', 'Values': [vpc_id]}])
    subnets = subnets_response['Subnets']

    private_subnets = []

    for subnet in subnets:
        route_table_response = ec2.describe_route_tables(Filters=[{'Name': 'association.subnet-id', 'Values': [subnet['SubnetId']]}])
        route_tables = route_table_response['RouteTables']

        for route_table in route_tables:
            has_internet_route = False
            for route in route_table['Routes']:
                if route['DestinationCidrBlock'] == '0.0.0.0/0':
                    has_internet_route = True

            if not has_internet_route:
                private_subnets.append(subnet['SubnetId'])

    return private_subnets
For private subnets without internet access, we want to check if there are VPC endpoints for the five services (ssm, ec2messages, ssmmessages, monitoring, and s3). You can use this function to check a VPC for the list of required endpoints:
def get_missing_vpc_endpoints(credentials, region, vpc_id):
    session = boto3.Session(
        aws_access_key_id=credentials['aws_access_key_id'],
        aws_secret_access_key=credentials['aws_secret_access_key'],
        region_name=region
    )

    ec2 = session.client('ec2')

    endpoints_response = ec2.describe_vpc_endpoints(Filters=[{'Name': 'vpc-id', 'Values': [vpc_id]}])
    existing_endpoints = set(endpoint['ServiceName'] for endpoint in endpoints_response['VpcEndpoints'])

    required_services = [
        'com.amazonaws.' + region + '.ssm',
        'com.amazonaws.' + region + '.ec2messages',
        'com.amazonaws.' + region + '.ssmmessages',
        'com.amazonaws.' + region + '.monitoring',
        'com.amazonaws.' + region + '.s3'
    ]

    missing_endpoints = []
    for service in required_services:
        if service not in existing_endpoints:
            missing_endpoints.append(service)

    return missing_endpoints
Once we’ve identified the missing VPC endpoints, we need to identify a private subnet in which to put them. The subnets will need to have available IP addresses, so make sure the code accommodates that. Once you have an identified subnet, you can use this function to create the endpoint:
def create_vpc_endpoint(credentials, region, vpc_id, subnet_id, service_name):
    """
    Note, this function assumes that every service except for a S3 uses a Gateway endpoint.
    This is sufficient for the 5 services needed for CW/SSM agents, but is not generally true.
    """
    session = boto3.Session(
        aws_access_key_id=credentials['aws_access_key_id'],
        aws_secret_access_key=credentials['aws_secret_access_key'],
        region_name=region
    )

    ec2 = session.client('ec2')

    if service_name == 'com.amazonaws.' + region + '.s3':
        response = ec2.create_vpc_endpoint(
            VpcId=vpc_id,
            ServiceName=service_name,
            RouteTableIds=[subnet_id],   # Route table ID should be specified for Gateway endpoints
            VpcEndpointType='Gateway'
        )
    else:
        response = ec2.create_vpc_endpoint(
            VpcId=vpc_id,
            SubnetIds=[subnet_id],
            ServiceName=service_name,
            VpcEndpointType='Interface'
        )

    return response['VpcEndpoint']
To recap, in this section we’ve defined the following set of functions:
get_credentials(account_id): – returns the AWS credentials for the given accountid (implementation not provided).describe_vpc_attribute(credentials, region, vpc_id, attribute): – retrieves the specified VPC attribute for given VPC ID, credentials, and region.enable_dns_support_and_hostnames(credentials, region, vpc_id): – enables DNS support and DNS hostnames for a given VPC ID, credentials, and region if they are disabled.get_active_ec2_instances(credentials, region): – returns a list of active EC2 instances for a given set of credentials, and region.get_ec2_instance_vpcs(credentials, region, instance_ids): – takes credentials, a region, and a list of EC2 instance IDs, and returns a dictionary with the instance IDs as keys and the corresponding VPC IDs as values.get_subnets_without_internet(credentials, region, vpc_id): – returns a list of subnets within the specified VPC that do not have an outbound route to the internet.get_missing_vpc_endpoints(credentials, region, vpc_id): – takes credentials, a region, and a VPC ID and returns a list of missing VPC endpoints (ssm,ec2messages,ssmmessages,monitoring,s3) in the specified VPC.create_vpc_endpoint(credentials, region, vpc_id, subnet_id, service_name): – for specified credentials, region, VPC ID, subnet ID, and service name, create the VPC endpoint. The service names are of the formcom.amazonaws.<REGION>.<SERVICE_NAME>as given by the table above.
These functions, plus the (account, region) pairs returned by the initial CUR query, are the building blocks for ensuring that the CloudWatch and SSM agents have the access they need to the relevant AWS services.
Do it with CloudFix:
In CloudFix, the Fix VPC Endpoints for Agents finder/fixer implements this process automatically. Simply approve the changes and the VPC endpoints will be created.
VPC endpoints do have an associated cost (which is why it’s important to eliminate idle ones.) However, the benefits from monitoring the instances outweigh the cost of the necessary endpoints. The price of the VPC endpoints is low relative to the savings that you can find with CloudFix specifically and the general savings that you can achieve with the knowledge and insights that the CloudWatch agent provides.
8. Responding to CloudWatch alarms with a Lambda Function
So far, we’ve talked about the fundamentals of CloudWatch, which metrics to monitor, how to install and configure the CloudWatch agent, and how to validate the VPC DNS and endpoints to give the CloudWatch agent the access that it needs to run.
Next up, let’s talk about how to react to a CloudWatch alarm. Remember from above that CloudWatch alarms are how we take action based on the inputs of CloudWatch metrics.
CloudWatch can be configured to trigger alarms in response to threshold values on certain statistics. In our Fixer blog on right-sizing EC2 instances, for instance, we talk about using CloudWatch to monitor memory usage in an instance after we’ve changed the instance size. So that we can respond appropriately to the alarm, we need to have a piece of code that’s hooked up to “listen” to the alarm.
We can use this command to set up the CloudWatch alarm:
aws cloudwatch put-metric-alarm \
    --alarm-name "HighMemoryUsageAlarm" \
    --alarm-description "Alarm when average memory usage exceeds 98% for 5 minutes" \
    --metric-name "mem_used_percent" \
    --namespace "YOUR_NAMESPACE" \
    --statistic "Average" \
    --period 300 \
    --threshold 98 \
    --comparison-operator "GreaterThanOrEqualToThreshold" \
    --evaluation-periods "1" \
    --alarm-actions "arn:aws:sns:REGION:ACCOUNT_ID:TOPIC_NAME" \
    --dimensions "Name=InstanceId,Value=YourInstanceId" \
    --unit "Percent"
This code creates an alarm called HighMemoryUsageAlarm. The alarm is configured to monitor the mem_used_percent metric. It looks at the average value of that metric over a five minute period (specified as a 300 second period in the options). If the average value of mem_used_percent is at or above 98% for five minutes, CloudWatch can be configured to send a message to an SNS topic. The details of the SNS topic are set by the –alarm-actions option.
If you aren’t familiar with SNS, it’s basically a message bus for AWS services to communicate with each other, like a Slack channel for AWS services. SNS is excellent for “fan out” style messages, where the communicator can notify many different listeners simultaneously.
Importantly, a Lambda function can be triggered by an SNS message. This allows for the creation of a feedback loop. The process becomes:
- EC2 instance gets monitored by CloudWatch
- If an EC2 instance is using too much memory, CloudWatch uses SNS to send a message to the HighMemoryUsage SNS topic
- A Lambda function is triggered by the SNS message
- The Lambda function increases the memory available to the instance
Here’s what that looks like visually:
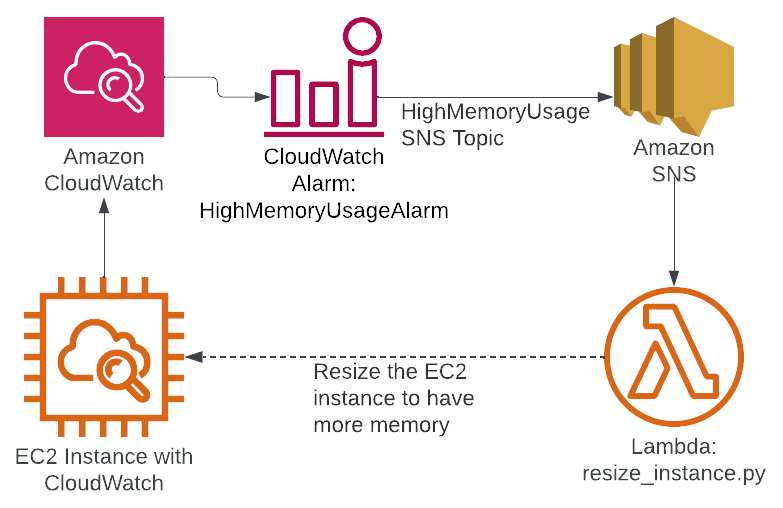
Figure 1: CloudWatch alarm infrastructure
You can see how this creates a feedback loop. CloudWatch monitors the memory usage and then resizes the instance as appropriate. Of course, this depends on the implementation of resize_instance.py. If the load changes on the instance, then CloudWatch can resize it.
Here’s a CloudFormation template for implementing this infrastructure:
AWSTemplateFormatVersion: '2010-09-09'
Description: CloudFormation template to create a CloudWatch Alarm for high CPU utilization and a Lambda function to resize the EC2 instance

Parameters:
  InstanceId:
    Description: The ID of the EC2 instance to monitor and resize
    Type: String

  S3Bucket:
    Description: The S3 bucket containing the Lambda function code
    Type: String
  S3Key:
    Description: The S3 key of the Lambda function code
    Type: String

Resources:
  HighCPUAlarm:
    Type: AWS::CloudWatch::Alarm
    Properties:
      AlarmDescription: Monitor CPU utilization and trigger resize if > 90% for 5 minutes
      Namespace: AWS/EC2
      MetricName: CPUUtilization
      Statistic: SampleCount
      Period: 300
      EvaluationPeriods: 1
      Threshold: 90
      ComparisonOperator: GreaterThanOrEqualToThreshold
      AlarmActions:
        - Ref: ResizeSNS
      AlarmDescription: High CPU / resize trigger
      Dimensions:
        - Name: InstanceId
          Value: !Ref InstanceId

  ResizeSNS:
    Type: AWS::SNS::Topic

  AlarmSNSSubscription:
    Type: AWS::SNS::Subscription
    Properties:
      Protocol: lambda
      TopicArn: !Ref ResizeSNS
      Endpoint: !GetAtt InstanceResizeFunction.Arn

  InstanceResizeFunction:
    Type: AWS::Lambda::Function
    Properties:
      FunctionName: InstanceResizeFunction
      Handler: resize_instance.handler
      Runtime: python3.8
      Role: !GetAtt LambdaExecutionRole.Arn
      Code:
        S3Bucket: !Ref S3Bucket
        S3Key: !Ref S3Key

  LambdaPermission:
    Type: AWS::Lambda::Permission
    Properties:
      FunctionName: !Ref InstanceResizeFunction
      Action: 'lambda:InvokeFunction'
      Principal: sns.amazonaws.com
      SourceArn: !Ref ResizeSNS

  LambdaExecutionRole:
    Type: AWS::IAM::Role
    Properties:
      AssumeRolePolicyDocument:
        Version: '2012-10-17'
        Statement:
          - Effect: Allow
            Principal:
              Service:
                - lambda.amazonaws.com
            Action:
              - sts:AssumeRole
      ManagedPolicyArns:
        - arn:aws:iam::aws:policy/service-role/AWSLambdaBasicExecutionRole
      Policies:
        - PolicyName: EC2ResizingPermissions
          PolicyDocument:
            Version: '2012-10-17'
            Statement:
              - Effect: Allow
                Action:
                  - ec2:DescribeInstances
                  - ec2:StopInstances
                  - ec2:StartInstances
                  - ec2:ModifyInstanceAttribute
                Resource: '*'
The resources described in this CloudFormation template include:
- A CloudWatch alarm
- An SNS topic
- An SNS subscription, associated with the Lambda
- A Lambda function, backed by Python
- A Lambda permission, such that the Lambda can be triggered by the SNS topic
- A Lambda execution role, so that the Lambda function can resize the EC2 instance
This CloudFormation template can be deployed by the AWS CLI:
aws cloudformation deploy                \
  --stack-name MY-INSTANCE-RESIZE-STACK  \
  --template-file cloudformation.yaml    \
  --parameter-overrides                  \
    InstanceId=i-1234567890abcdef0       \
    S3Bucket=my-bucket                   \
    S3Key=function.zip                   \
  --capabilities CAPABILITY_IAM
The Python function to resize this instance will have this basic structure:
import json
import boto3

def get_bigger_instance(cur_instance_type):
    # You need to implement this
    pass

def handler(event, context):
    print("Received event: " + json.dumps(event, indent=2))

    if event.get("AlarmName"):
        instance_id = event["Trigger"]["Dimensions"][0]["value"]
        ec2 = boto3.resource("ec2")
        instance = ec2.Instance(instance_id)
        instance_type = instance.instance_type

        new_instance_type = get_bigger_instance(instance_type)

        print(f"Stopping instance {instance_id}...")
        instance.stop()
        instance.wait_until_stopped()

        print(f"Changing the instance type to {new_instance_type}...")
        instance.modify_attribute(InstanceType=new_instance_type)

        print("Starting the instance again...")
        instance.start()

    return "Done"
You can implement get_bigger_instance(cur_instance_type) based on your preferences.
As you can see, it’s straightforward to connect a CloudWatch alarm to a Lambda function and have that Lambda function take action. Obviously, monitoring memory usage and resizing instances isn’t the only application of this capability. With this basic structure, you can react to any CloudWatch alarm to address a wide range of scenarios.
9. CloudFix ❤s CloudWatch
Here at CloudFix, we’re big fans of CloudWatch. We use data to power our finders and fixers, and CloudWatch is one of the key sources of data about AWS deployments. No matter where you are in your cloud journey, it’s worth taking some time to familiarize yourself with this powerful tool. It’s easy to get started with the free metrics associated with each service and then expand into custom metrics and dashboards as you get more comfortable.
Hopefully this “starter pack” has been a useful introduction to CloudWatch. For more information, read the AWS documentation, watch AWS’s CloudWatch talks, or ask Rahul and Stephen on our weekly livestream. Happy CloudWatching!